FineReport Community
Title: User map system enables precision marketing, which improves user conversion rate by 20% [Print this page]
Author: FineMonkey Time: 2020-5-28 11:47
Title: User map system enables precision marketing, which improves user conversion rate by 20%
Company: Changjiang Securities
Industry: Security
Region: Hubei Province
Product: FineReport
Scenario: Marketing, Service, Users
Scale:¥Billion
Status: Industry Leader in Hubei Province
Year: 2019
Changjiang Securities has effectively improved the efficiency of each line of business by using the FineReport reporting system. However, with the growth of data analysis needs, the reporting system gradually becomes bloated.
After analysis, Changjiang Securities believes that the root is that the business side does not have a clear and complete business logic thinking, ignoring the value of the data itself.
By sorting out the business lines and centering on the customers, Changjiang Securities constructed the "user map" system. Precision marketing is carried out based on user portrait, forming a closed-loop of user data, user labels, customer segments, marketing activities, and optimized labels. In the end, while the number of service users dropped by 75%, the conversion rate increased by 20%.
1. Company Profile
Changjiang Securities Company Limited is a securities company headquartered in Wuhan, Hubei, China. It involves commission sales and purchase of securities, agency of debt services and dividend distribution of securities, custody and authentication of securities, agency of registration and accounts opening, self-support sales and purchase of securities, underwriting of securities, consulting of securities investment and trustee investment management.It has a network of 41 branches, 253 securities sales departments, and 21 futures business departments across the country.
The company was established in 1901, which used to be Hubei Securities Company. It was renamed "Changjiang Securities Company Limited" in 2002. In 2007, it achieved a backdoor listing through a merger with Shijiazhuang Petrochemical Company Limited, a subsidiary of Sinopec.
2. Project Background
We have been using the FineReport reporting system to provide other teams with support for departmental data query and data processing automation. This mode of work effectively solves the core pain points of the business team, such as manual data processing, long data query process, complicated EXCEL analysis, etc.
Through a large number of data mining and analysis, it provides an innovative breakthrough for the department's marketing, account opening, and other core businesses. It effectively improves the efficiency of each business line. But the disadvantages of this mode of work become more and more obvious with the surge of business demand. The data analysis needs of business departments are too trivial, which dramatically increases the workload of report developers. The reporting system is gradually become bloated, with 10 to 15 reports in each business system on average. And the report contents are seriously homogenized, the indicators displayed in the report are disorderly, and there is no unified standard.
We repeatedly analyzed the previous passive data analysis model. We found that the business requirements were complicated because the business side did not have a clear and complete business thinking logic, resulting in scattered data not being aggregated and correlated. The data are not isolated, but their value has been neglected. Therefore, we decided to dig deep into the value of the department's data, sort out the business framework of the department, to build a complete data analysis system.
After sorting out the business lines, we found that the core breakthrough of all businesses is the company's customers. The primary attributes, transaction data, and behavioral data of the customer constitute the underlying data source of the user's portrait. By mining the data source and conducting feature engineering and analysis of algorithms, we can build the primary tag of the user. Based on user tags, we can do user clustering and conduct different marketing activities analysis for various groups. The marketing results can be used for the re-optimization of user tags to form a closed loop of user data, user tags, customer segments, marketing activities, and optimized tags.
To realize the above data closed-loop, a complete set of algorithm platform is needed. FineReport provides API for Transwarp Inceptor. Therefore, we use FineReport as front end display output and event interface, use Transwarp Inceptor to handle the submitted data analysis tasks, such as custom customer group, customer group attribute analysis, tag calculation. TDH provides a storage and computing framework as the data background. Based on this data platform, business personnel can directly gain breakthrough insights from the user's perspective, design a more reasonable marketing service model. It makes report development modular and releases the pressure of report developers.
3. Application Scenarios
3.1 Digital Marketing, Unified Online, and Offline
3.1.1 Pain Point
In the traditional offline marketing process, it is difficult to have an excellent platform for operations and relevant leaders to understand their user situation. As the number of users continues to grow, every marketer, business department, or branches, does not have an effective way to reach their users. Therefore, in the targeted marketing activities, such as the sales of financial products, the previous model based on the experience of marketing staff and operation staff for crowd search. This mode caused inaccurate targeting. On the one hand, the marketing staff spends a lot of time on promoting products to those who are not suitable. On the other hand, the user who really needs the products is not timely tracked and communicated.
3.1.2 ProcessTo solve this problem, we use FineReport to design and make the user map system. The user map system has 11 sections in total, including user insight, user grouping, user portrait, business line situation, user life cycle, and other parts. The scheme mainly includes the following implementation processes.
1) User needs survey: Users here refer to the company's marketing staff, operations staff, and relevant leaders. Through the understanding and interview of each operation team, we can fully understand the user indicators and dimensions they need. This helps the front-end presentation process accurately demonstrate the metrics that operations marketers need, so as to facilitate their operation and marketing to users. Besides, the department's data analysts have a complete set of user analysis framework and modeling experience, combined with these existing results and planned sections, make our system framework more perfect and reasonable.
2) Data processing: After the survey, we sorted out the overall framework of the user map system according to the information obtained. Also, sorted out and calculated the relevant indicators. Besides, unifying and integrating existing data as well as the data that has not existed to ensure the completeness, accuracy, and timeliness of the data.
3) Implement the reports: The report has a total of 11 modules, each with several chapter options. It uses almost all the functions commonly used in FineReport, including chart functions, button functions, and so on. Users can use the data entry, analysis, download, and other features.
4) Permission assignment:After the completion of the report, according to the different levels of marketing staff, we carried out a set of account specifications. For example, the marketing staff can view the data within their permission while the team leader or administrator can view the data under their jurisdiction. The operation staff of the headquarters can view more data, and each employee can check the situation of the users under their name at any time.
5) Specific functions: the user map system mainly has five features.
① User clustering mining. The administrator can divide the user group arbitrarily according to the dimensions in the system, such as the user's age, gender, assets, transactions, or product purchases. And through the user insight function, the administrator can access the dimensions of the segmented user groups. For example, if we select a user group of 1000 people who buy fixed income products, the administrator can check the indicators of the group in various scenarios from basic attributes to transaction style.

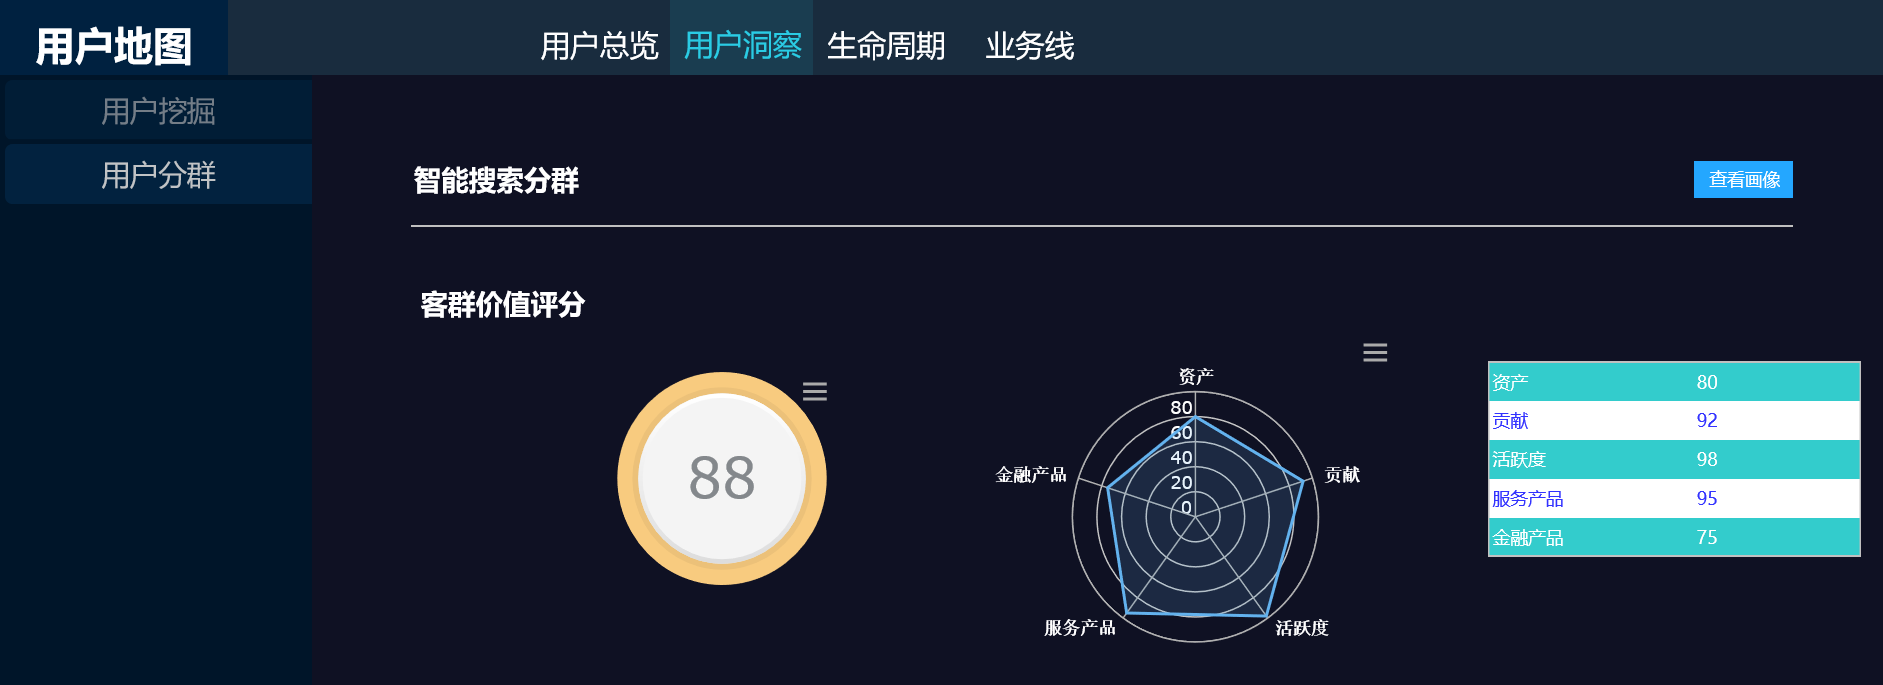
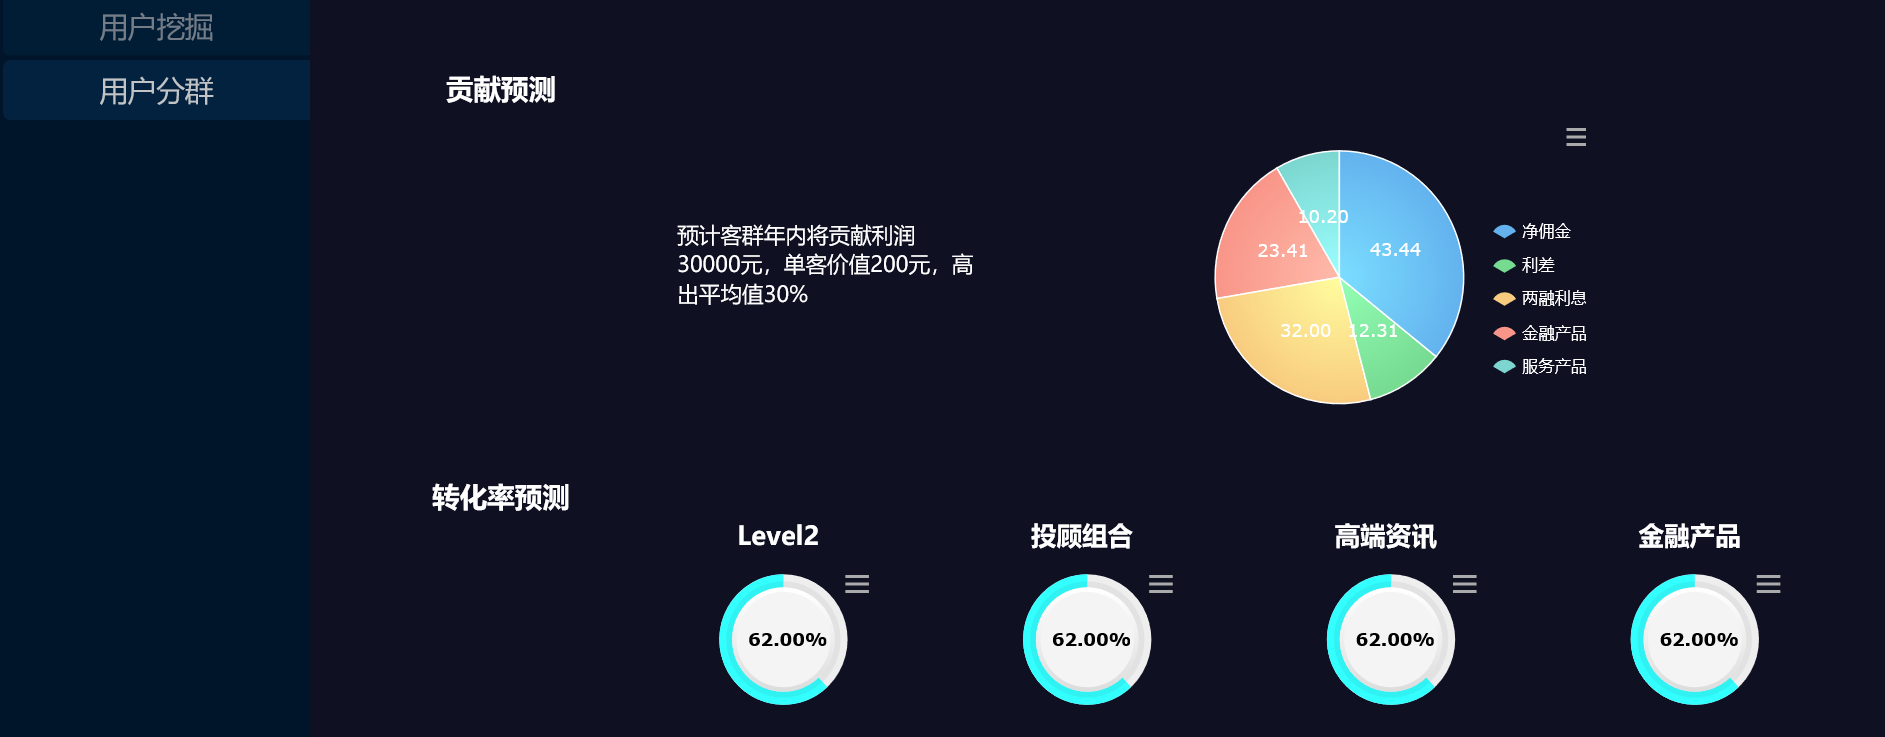
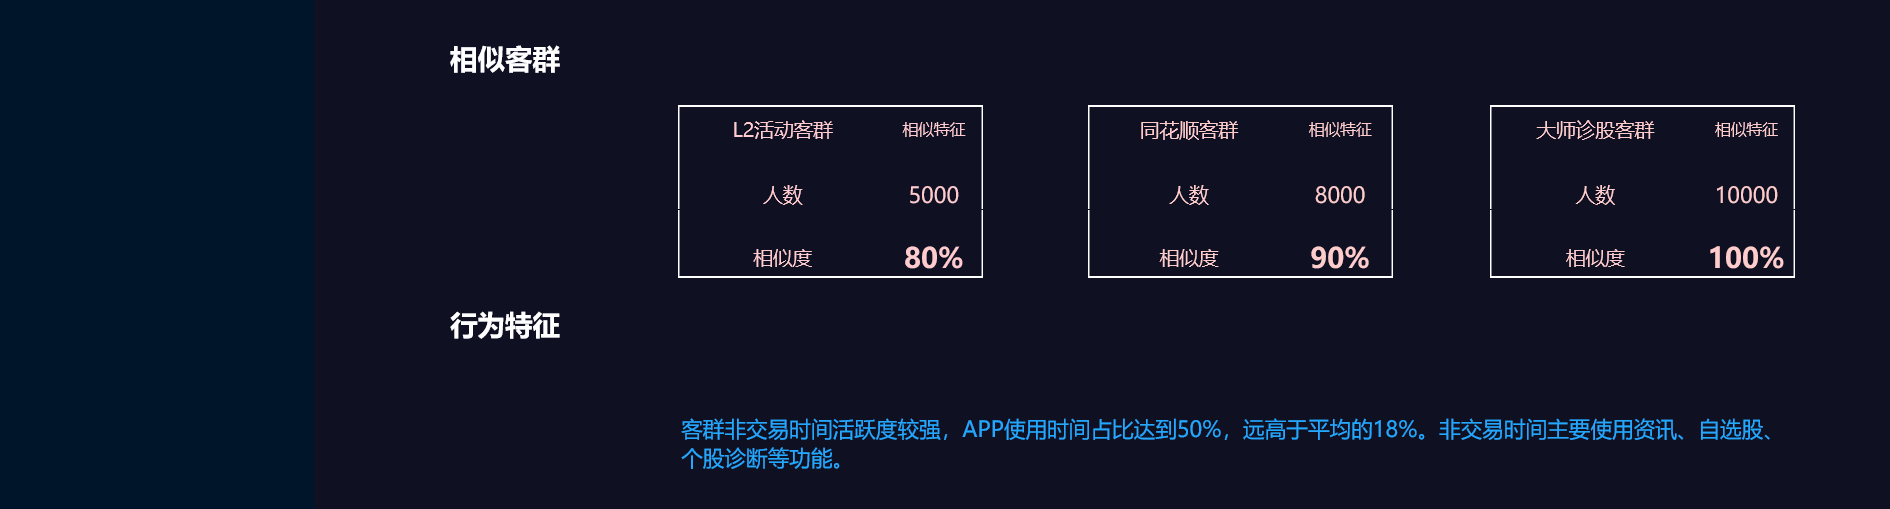
② User insight: This section is an excellent visual display of the selected customer groups for the operation staff. It includes the user group's overall score, contribution, and forecast sales conversion rate. User insights can help marketers determine whether the customer base they are screening meets criteria. Besides, information about similar customer groups can help operators find more target customers.
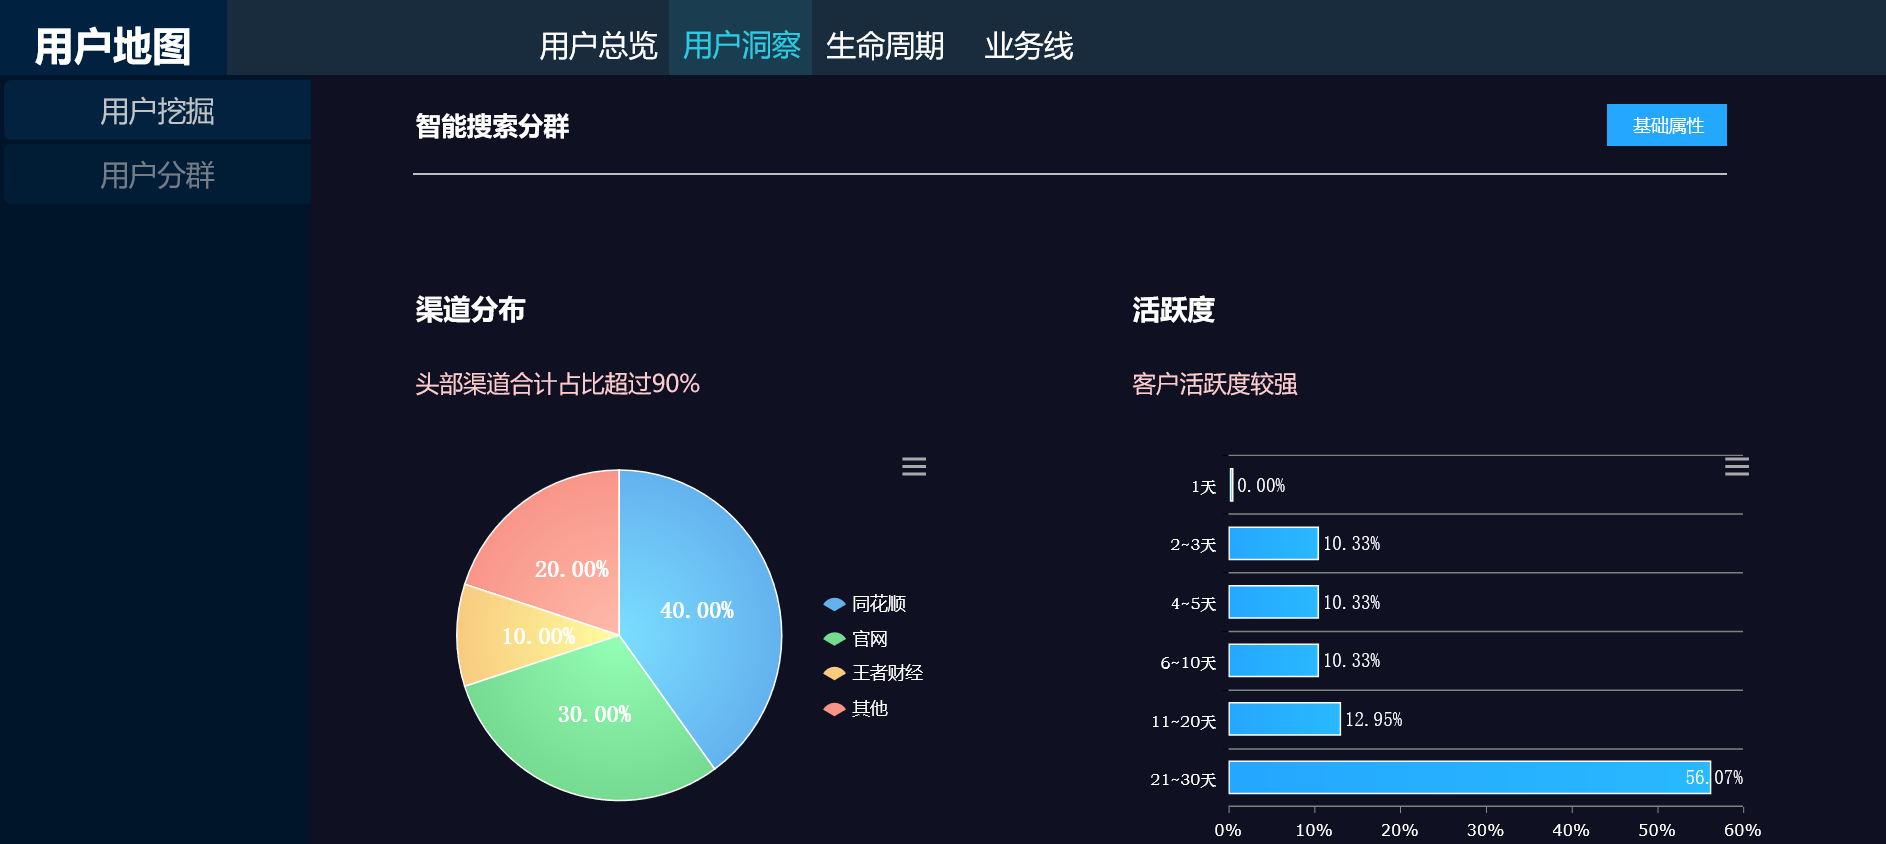
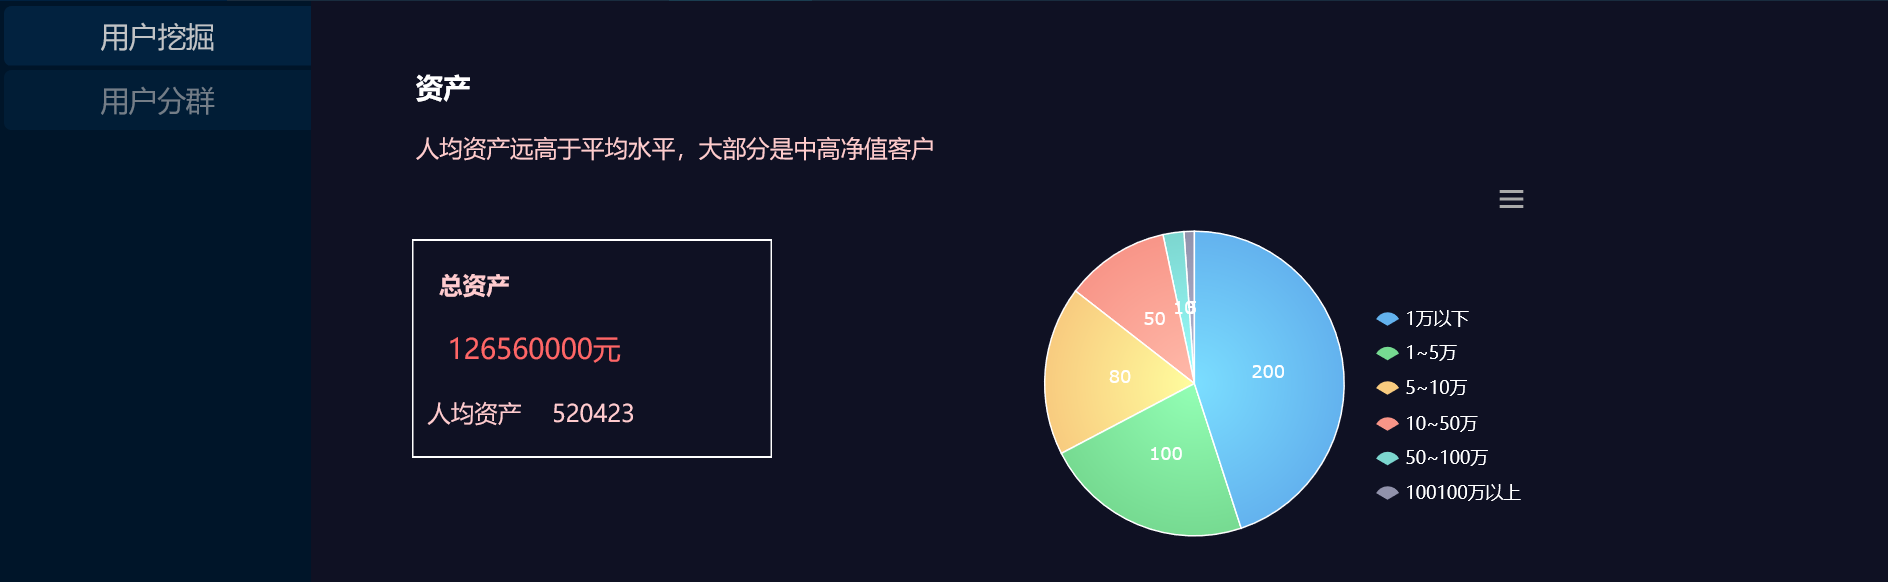
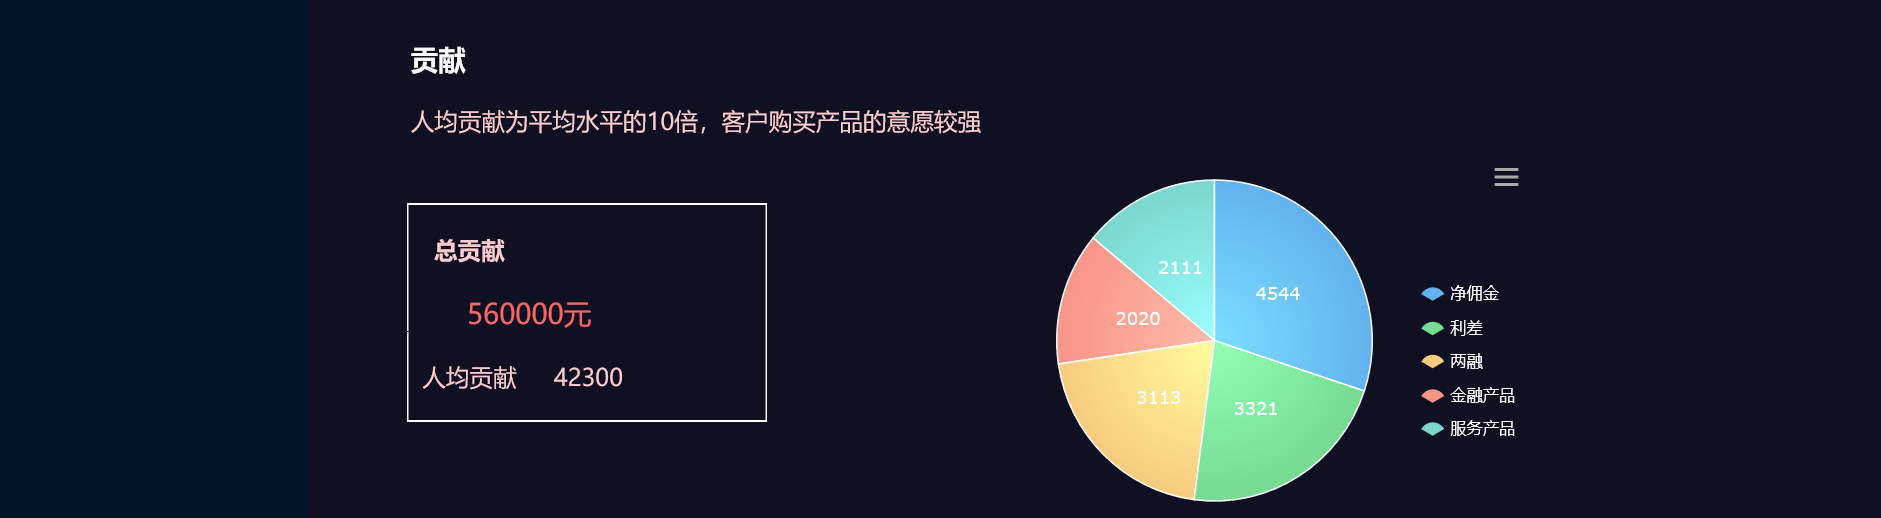
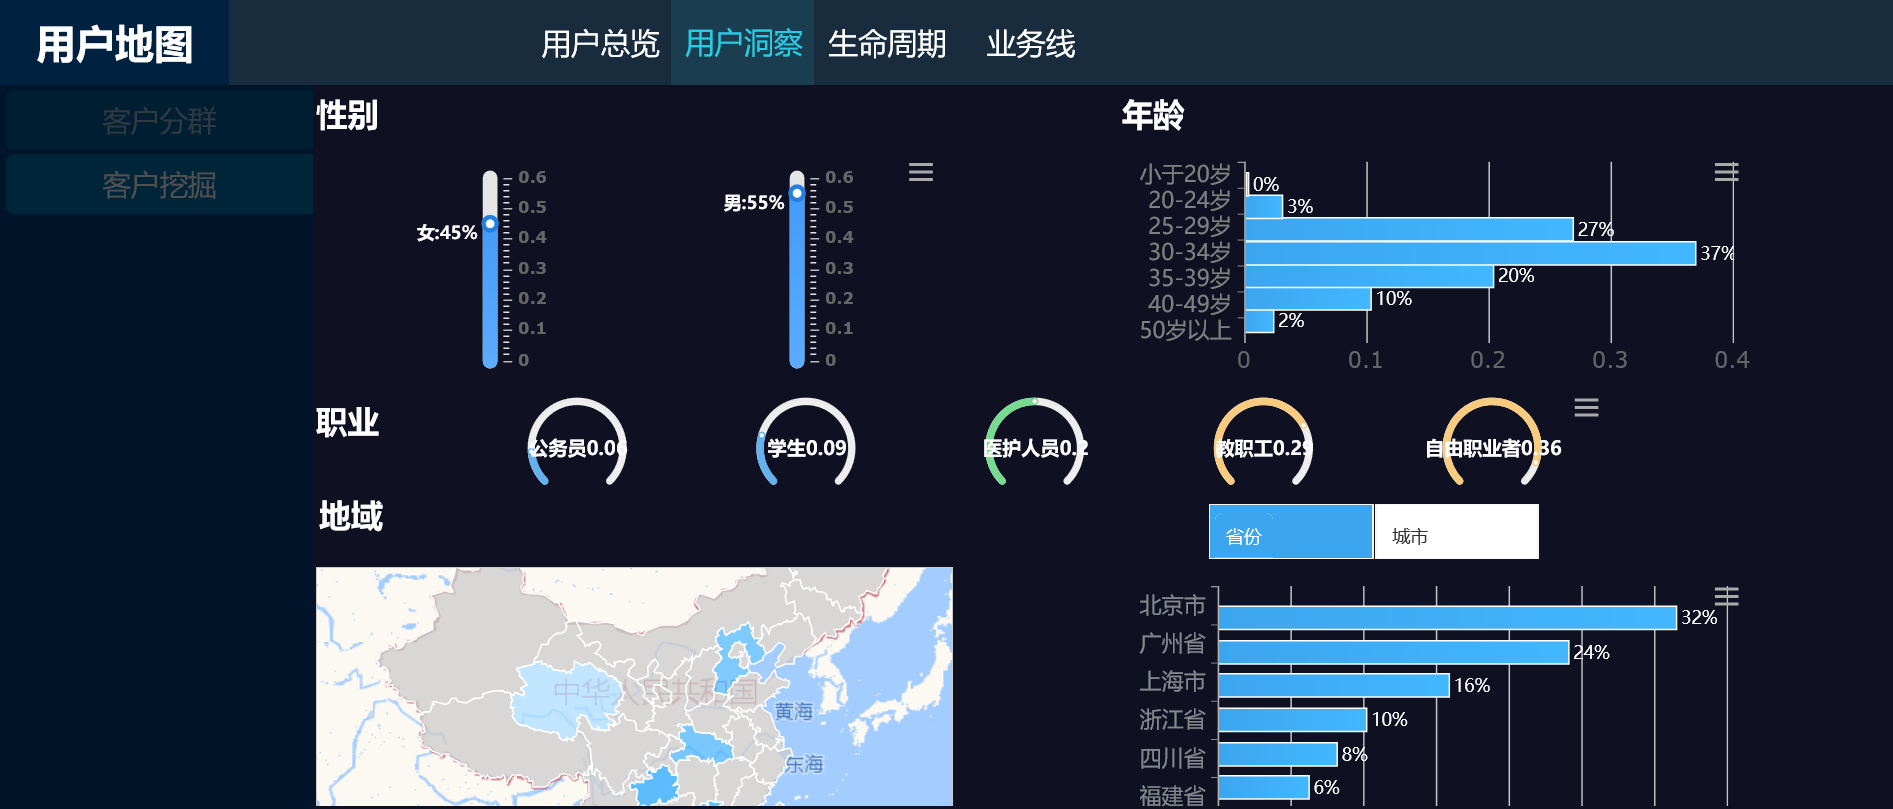
③ User Portrait: The user insight module helps better view the characteristics of target users, facilitate the development of marketing activities, and improve conversions. The user portrait section is to display the user's various dimensions, including the user's channels, activity level, asset status, and contribution preference. This section allows marketers to observe the situation of the customer base in real-time and make relevant decisions timely.
④ Business Lines Management: According to the division of business lines of the department, this section shows the situation of each business line, including the sales of financial products, sales of investment services, new account opening, and so on. This section can make the staff of each business line more targeted to check the real-time situation of their own business, timely make business adjustments, and improve the responsiveness of the business.
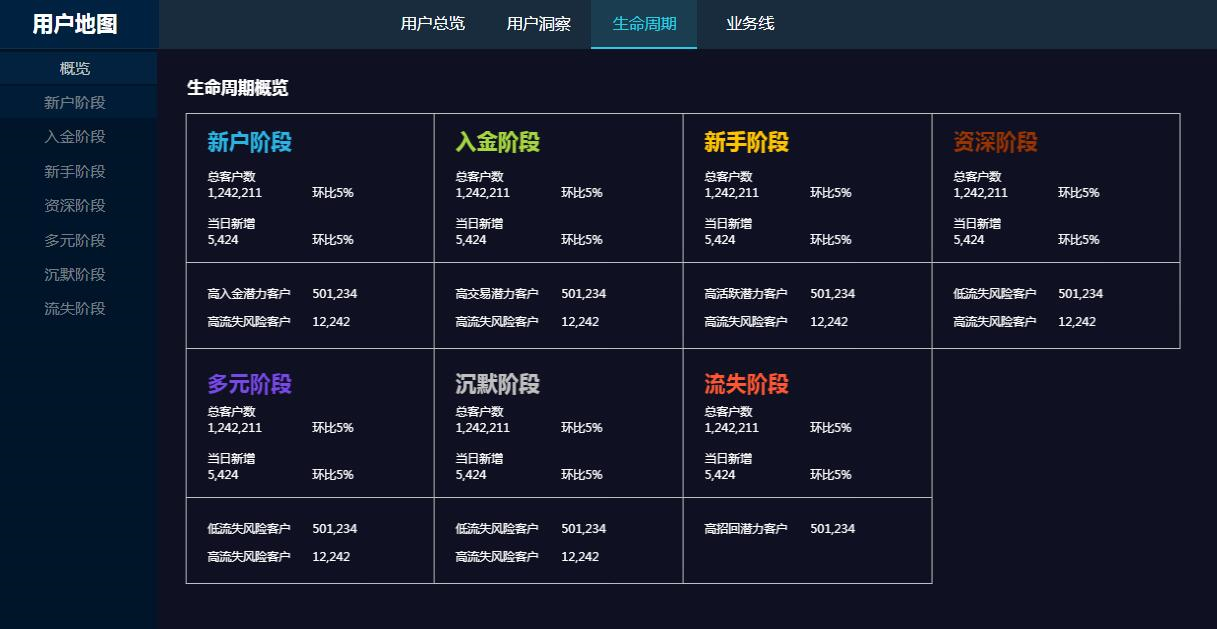
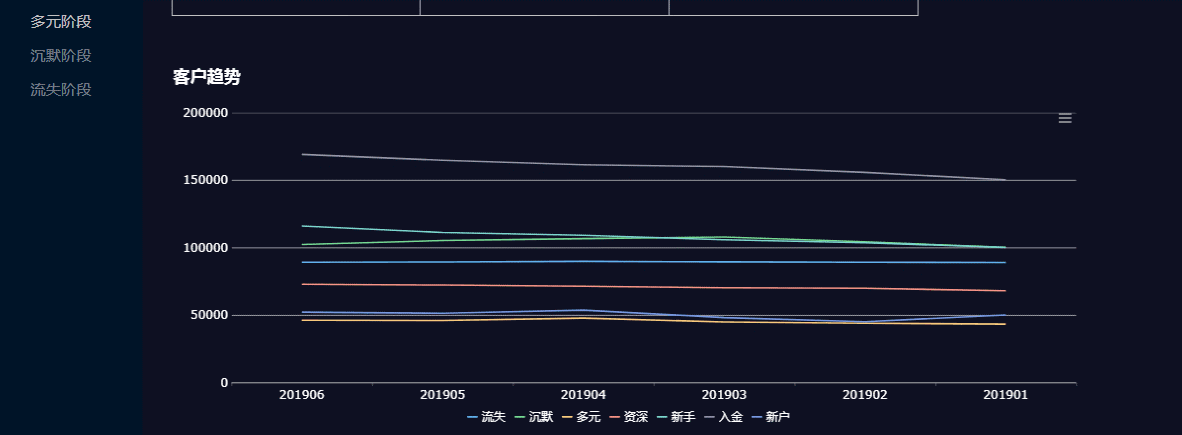
⑤ User life cycle: From the perspective of the life cycle, this section shows the distribution of customers in the introduction stage, growth stage, maturity stage, and decline stage. It is convenient to analyze the characteristics of users, explore the customers' different situations at each stage, and make the corresponding adjustment of marketing strategies promptly.
3.1.3 Value
The user map mining and monitoring function significantly improve the efficiency of marketing activities and bring a lot of convenience to offline and online marketing.
- Filter and send online users quickly. Operators can use the system to quickly filter the targeted users, which makes online push more accurate. The coupon conversion rate increased by 100% on average, and the conversion rate of purchase increased by 50% on average.
- Save employee costs offline. Offline administrators can assign marketers more accurate and fewer users as administrators can accurately locate users. This allows marketers to focus more on serving their target audience, rather than bombarding them with mass phone calls.
- After using the system, the average number of service users per marketer dropped from 200 to 50, but the conversion rate of users increased by 20%, and the total amount of product sales increased by 30%.
- Complete user group analysis improved decision efficiency. The leaders of the headquarters or the branches can understand the situation of users under their jurisdiction through the system. And track the user group to make the corresponding operational decisions timely. The time spent on user analysis is reduced by more than half, which improved decision efficiency.
3.2 Help Product Managers to Analyze the Users
3.2.1 Pain Points
A good product needs to be based on a good understanding of the user, but it is not enough for the product manager to know the user based on the data provided by the behavioral analytics platform (PV, UV, page path, funnel, etc.).
To obtain more accurate conclusions and assist product design, it is necessary to conduct in-depth research on user groups and do deep data mining and processing, combined with user labels and various business data.
Doing this kind of in-depth user research used to be time-consuming. For example, if the product manager wants to optimize a specific function, he must first determine the target user group and the characteristics he wants to analyze, and then the data team will conduct the data analysis.
For different needs, user groups, data, and characteristics, the result will be different. The results cannot be reused, which brings a lot of repeated work. Moreover, the user groups provided by the demand side may not be accurate enough, and the proposed features may be unclear, which will harm results. Therefore, there is an urgent need for a complete user research scheme to solve this pain point, which can not only accurately divide the user group, but also automatically use the data for feature analysis and provide overall in-depth analysis results. It can not only help product managers to analyze users by themselves, improve efficiency, but also get better analysis results.
Besides, the product manager will pay attention to the changes in the characteristics of the user base and adjust accordingly. In the past, product managers could only observe and analyze the reports regularly. For different subdivided products and their user groups, there were many reports. Moreover, for abrupt short-term changes, it is not possible to capture them quickly and may have missed the best opportunity to deal with them when they are discovered. Therefore, it is urgent to systematically monitor the characteristics of each user group to catch the changes.
3.2.2 Process
The core of the system is to solve the problems of user clustering, user group analysis, and monitoring. FineReport reporting system can quickly build the front page. Product managers can create new user groups by filling reports and can analyze group characteristics and monitoring the changes by the analysis reports. The implementation process is consistent with the scenario.
3.2.3 Value
The user map system has solved the product manager's pain point and greatly improved the efficiency and effect of user group characteristics research.
- It greatly improved the efficiency of user group characteristic research. In the past, it took a whole day to complete a single requirement manually, and the more user groups, the more workforce was consumed. Now, product managers only need to add new user groups. With the help of a back-end big data platform and algorithm platform, they can calculate the latest and most comprehensive analysis results in batches every day. Now more than 100 different user groups have been saved in the system, completely liberating the data analysts.
- It effectively improved the analysis effect. In addition to meeting the needs of product managers, the system can also provide other features to help product managers better understand the user and improve the product. In practice, by analyzing a product purchase, the final conversion rate was increased by 5% after targeted optimization.
- Explore more business scenarios. The similar customer group capabilities provided by the system can help product managers discover more user groups with similar characteristics, making it possible to discover new business scenarios. In practice, we found the characteristics of users who buy A product is similar to the users who buy B products as well the users who see class C information. Therefore, the product manager added the introduction and purchase entry of product A to the purchase process of product B and the information details page of class C. The improved visit and purchase volume of product A by more than 20%.
4.Project Experience
4.1 Success Experience
The biggest part of the work in Internet finance is the data display: How to extract the most appropriate business indicators and reflect the business value most intuitively? In this way, the operation staff can quickly understand the front-end business progress, facilitate a comprehensive user portrait, and at the same time, timely adjust the business plan through the core business indicators. The most valuable and interesting part of the work is data mining. We need to find out the product needs of users, promote product sales, and sell the products in advance. Meanwhile, we need to give early warning to prevent the loss of users.
Based on the above two requirements, we combine the two needs into a data product, reduced the product entrance, achieved the advantage of less entrance and more functions.
In the core design of the end of the product, we established a user dimension spreadsheets based on the user's primary attribute data, various transaction data, product sales data, external asset data, external account opening data, and linked label data. At the same time, we will put the user model labels we get from the data model, such as the purchase population model of Level2, into the spreadsheets, to realize the integration of the user's objective data labels and model data labels.
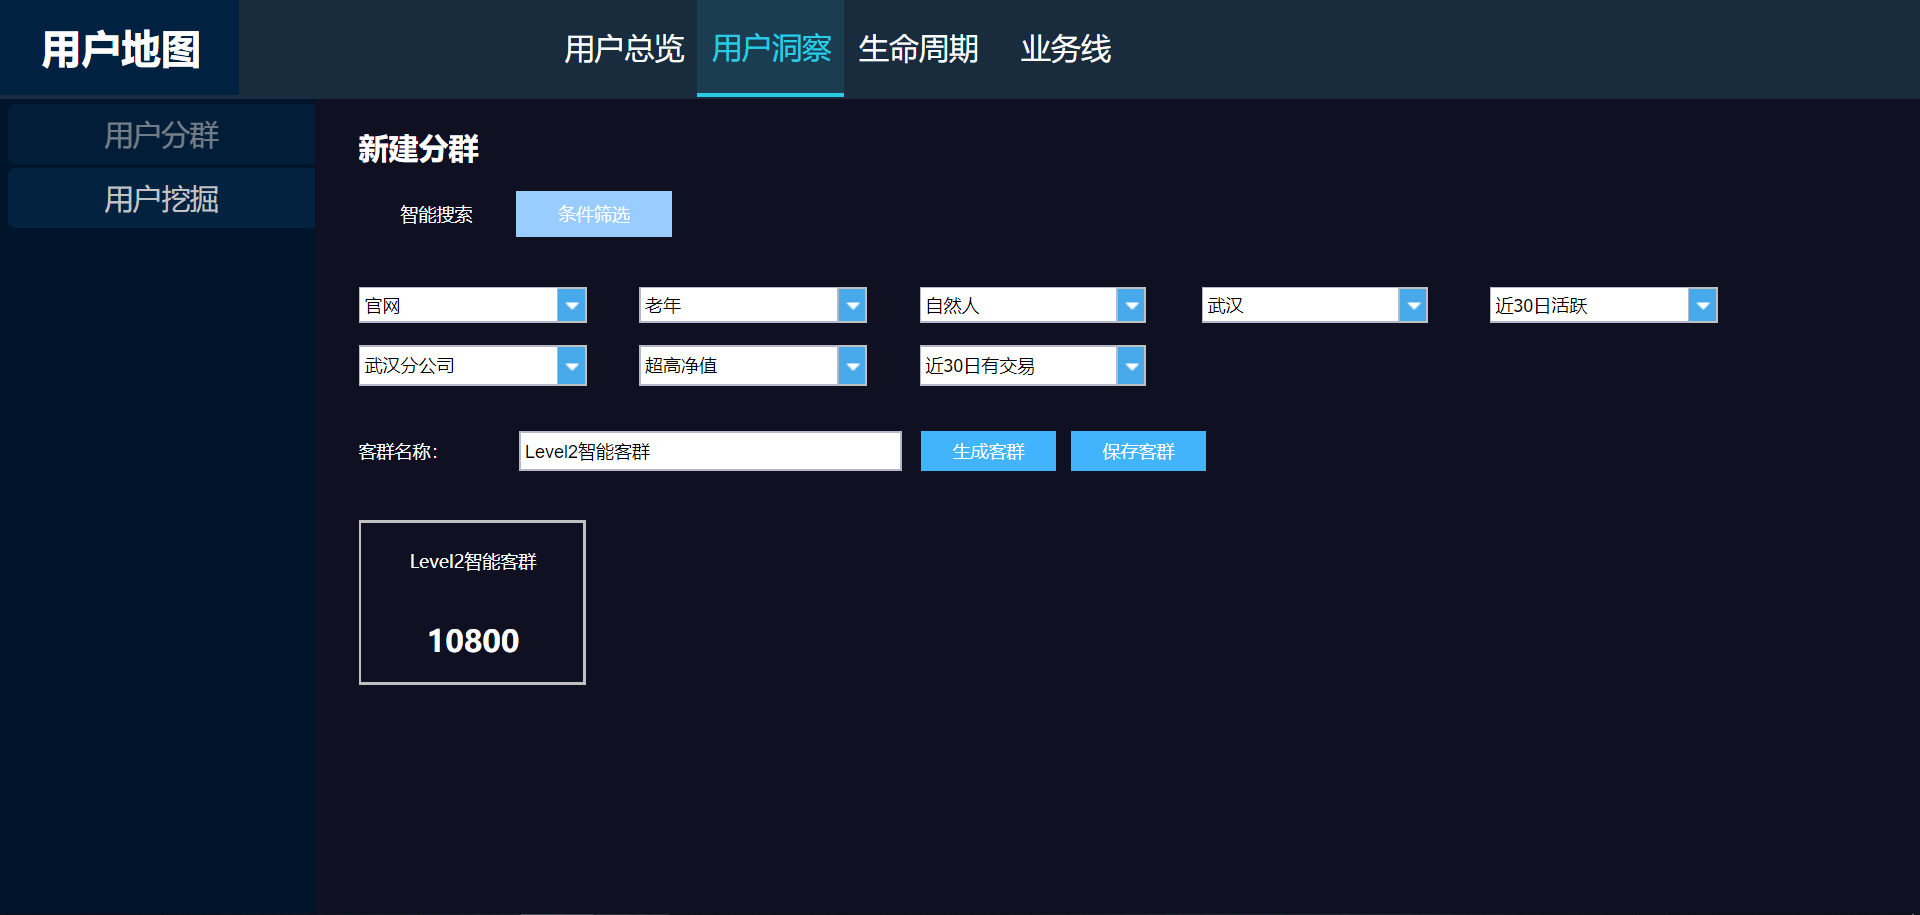
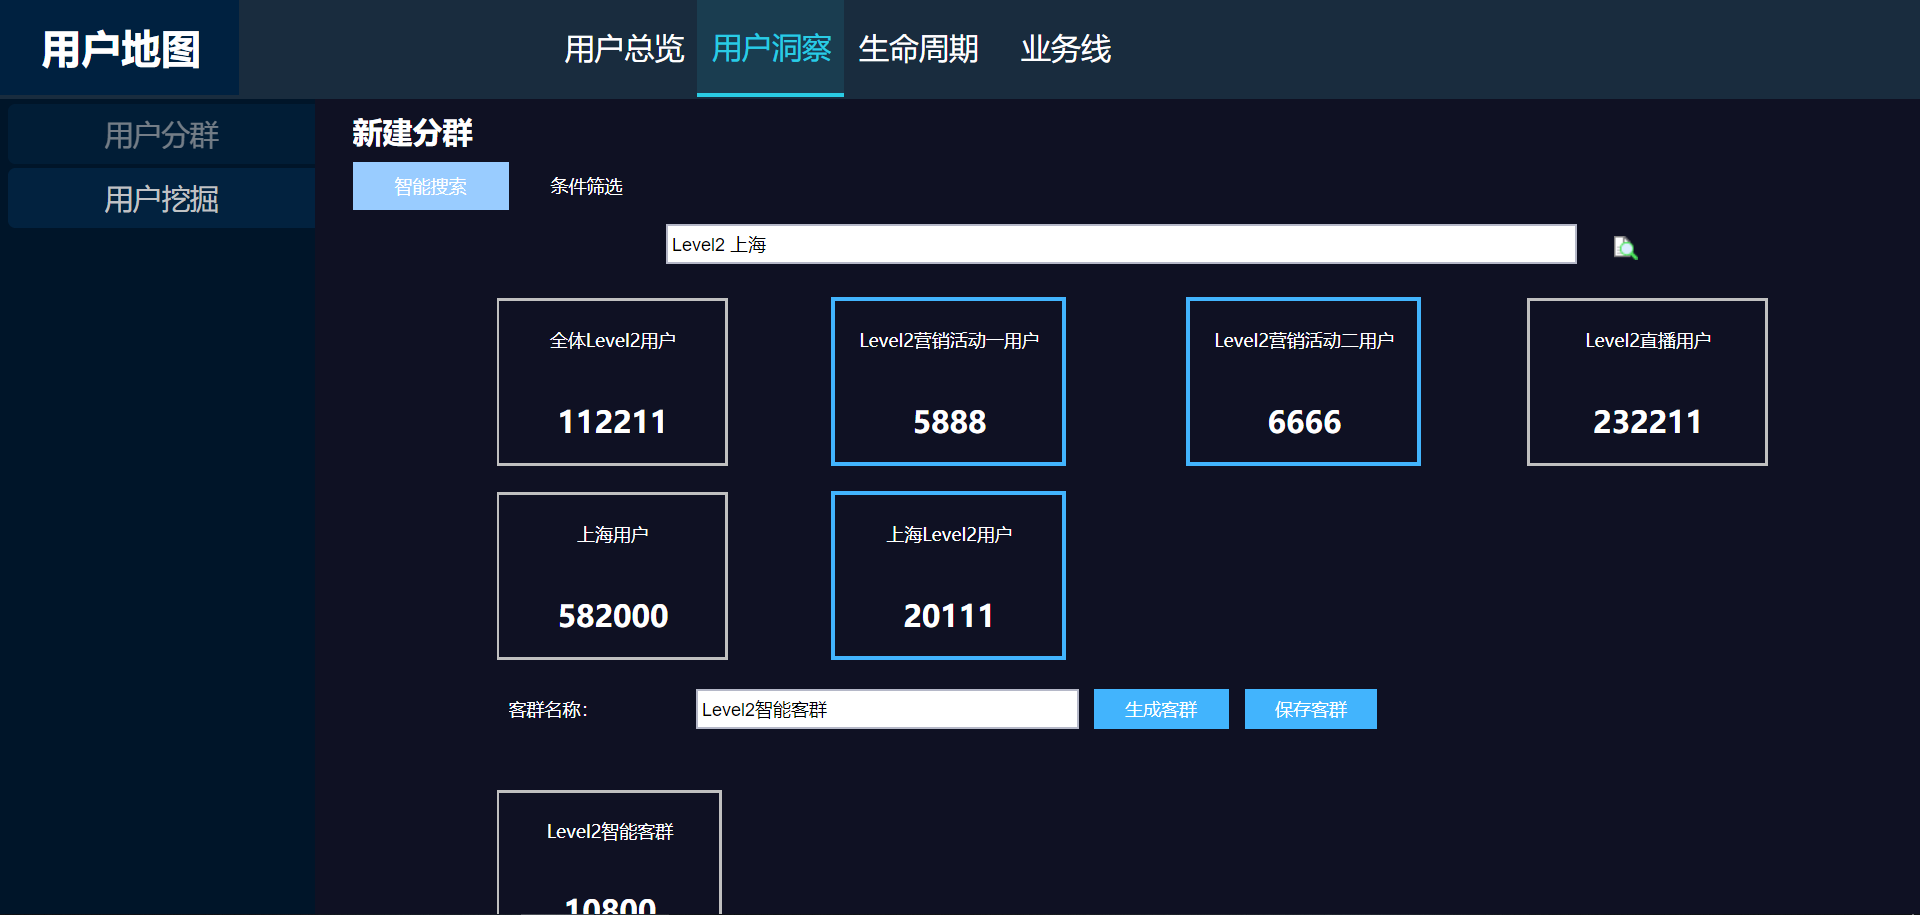
In the design of data products, the core is the intelligent grouping and conditional grouping. Intelligent grouping means that we divide some business groups according to our model, to facilitate users to select the customer group they want without fully understanding the business logic.
Conditional clustering is when the user understands the business logic, users can input any business data or user attributes, to select the customers that meet their requirements. We will provide a similar customer group at the bottom of the product to the customer group chosen by the conditions, which facilitates the marketing of the product.
Whether it is an intelligent grouping or conditional grouping, we can describe the customer group from the perspective of user attributes, exchange trading data, product purchase data, and user life cycle.
In particular, we can observe the life cycle of our company's products and understand the decay time of the life cycle. In this way, we can conduct marketing to users at the right time in the limited product life cycle, which helps us improve product sales and provide good services.
At the same time, in terms of early warning of abnormal changes, we monitor the transaction frequency, login times, asset amount, and other data to predict the users that will be lost. And push the specific information to the managers so that the managers can retain users.
The project cycle is three months, including the implementation of all the data, communicate with business staff, design, and development of back-end pages. In this process, you need to coordinate with the IT staff to create accurate spreadsheets. At the same time, it is also necessary to communicate with various business lines to implement business indicators and accurately understand their business needs. We also spent a lot of time on the page design. How to make the business indicators not to be repeatedly and logically put into the report is the success we have achieved after a continuous and in-depth understanding of the business, and is also the result of multi-party coordination.
4.2 Points of Improvement
Due to the short project cycle, we mainly combed and modeled the user's primary attributes, transaction data, product data, and external account opening assets data. However, we have not been able to put the style data of user transactions, such as the overall linked label data, the user behavioral data, and the click data on our APP into the project. In the future, we will consider adding the user's transaction style data and behavioral data into the project to achieve a full set of user monitoring: behavior -- transaction -- mining -- early warning.
| Welcome to FineReport Community (https://community.finereport.com/) |
Powered by Discuz! X3.2 |