FineBI Big Data Analytics Solution
- As a modern self-service BI tool, FineBI enables enterprises to swiftly establish a comprehensive data analysis platform. It empowers each team member to independently analyze and comprehend data, facilitating decision-making and improving business performance. With a complete BI solution, FineBI encompasses everything from data preparation and data processing to visual analysis of data and data sharing. It simplifies intricate technologies, enabling users to intuitively obtain information, discover insights, and share knowledge.
- FineBI offers multiple core features, including New Analysis Paths, Data Management, Data Editing, Powerful Functions, Data Visualization, Data Collaboration and Sharing, and Enterprise-Level Application.
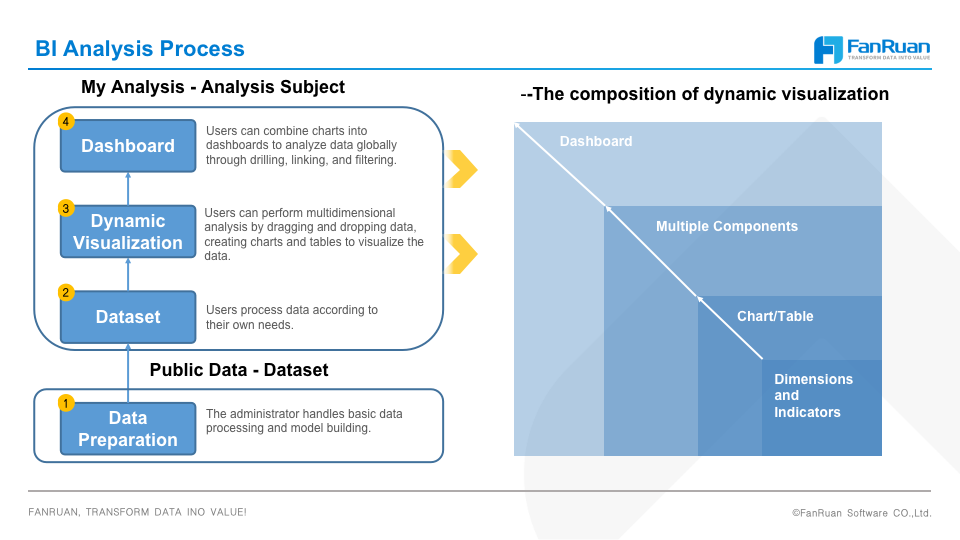
- FineBI presents users with subjects to streamline data, components, and dashboards for an in-depth analysis. With a clear operation path, users can grasp analysis skills effortlessly and immerse themselves in data exploration.
Welcome to the second session of the FineBI Basic Course! In this session, we will focus on FineBI's featured functions: Charts and Tables.
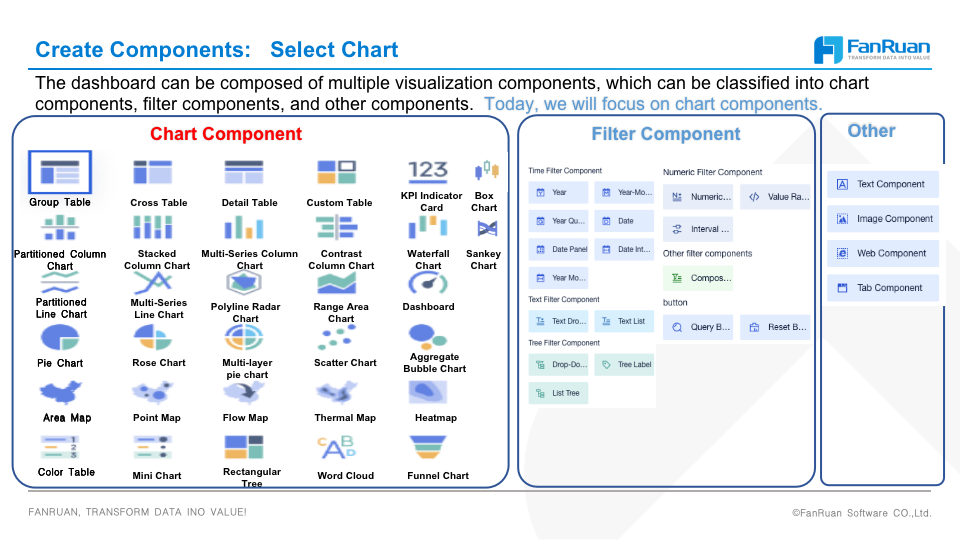
Charts and Tables components are the main elements of visual dashboards. By dragging data fields into the analysis area, we can create various types of charts and tables to visualize data.
What will be covered?
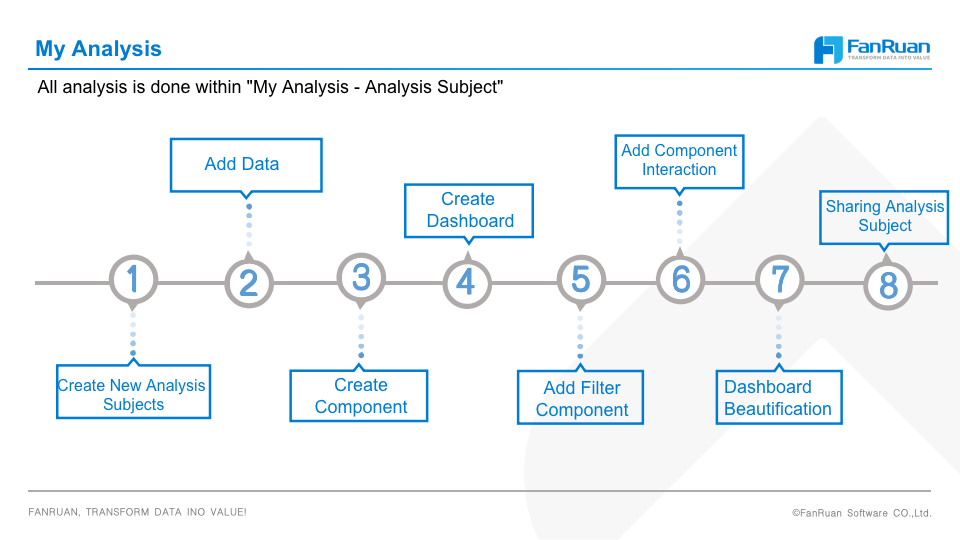
In this 90-minute training session, We will start by learning about the analysis process in FineBI, understanding how to consolidate all the analysis steps into an "Analysis Subject."
Additionally, we will demonstrate the process of creating charts and tables in FineBI through two common analysis scenarios, allowing for a deeper understanding of data analysis models and methods.
My Analysis
BI Analysis Process
Components Type
Pareto Analysis Introduction
The Pareto Analysis Method, also known as ABC Inventory Control Method, ABC Classification Method, Pareto Analysis, Pareto Chart Analysis, Vital Few and Trivial Many Analysis, or 80/20 Rule, is a technique used for inventory management and resource allocation. It is named after Vilfredo Pareto, an Italian economist who observed that approximately 80% of the effects come from 20% of the causes.


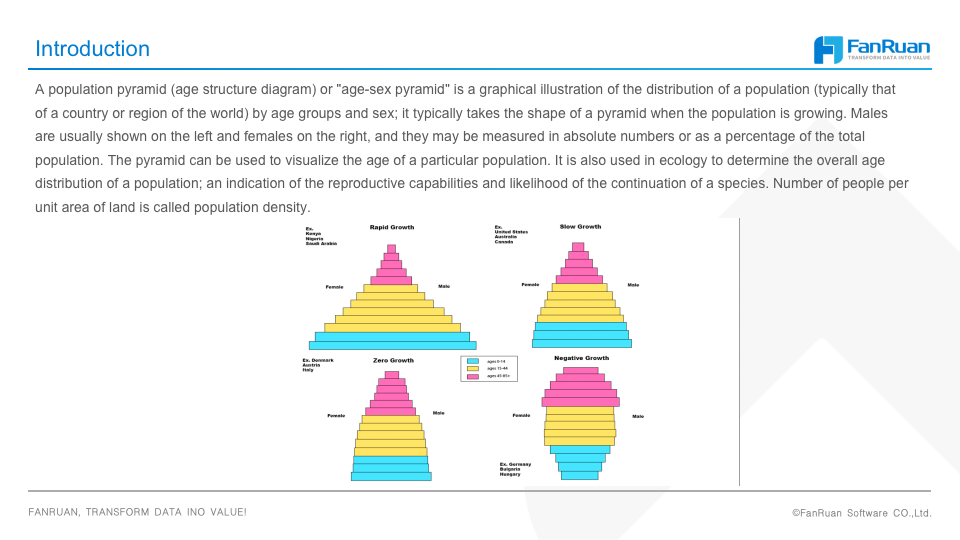
Population Pyramid Introduction
Population Pyramid Case

Who should attend?
This webinar is designed for those who are new/intermediate to FineBI and are looking to enhance their data analysis capabilities.
We welcome IT Engineers, Managers, Project Leads, and Analysts to join us from:
- Data Management
- Analytics/Business Intelligence/Insights
- Strategy/Innovation/Transformation
- Data Science
- Information Technology/Enterprise IT Architecture
- Operations (Marketing, Finance, Human Resources, Procurement, etc.)
To get fully prepared for the training section, please download and activate FineBI in advance.
You can also visit our FineReport & FineBI Global to follow the latest developments. We will share in the Youtube channel the courseware and learning resources. Please feel free to enjoy.
About the Speaker

Kaiyuan (Zayne) Zhao
FineBI Product Trainer
Proficient in the use of FineBI functions and system O&M, take you to analyze various complex data, and help the development of enterprise informatization.